


- U.S. Home Price Index up 9.2% in December from a year earlier, largest annual gain in more than six years fueled by low inventory and attractive low-interest rates
- Accelerating home prices could lead to affordability challenges in 2021
IRVINE, Calif. — (BUSINESS WIRE) — February 2, 2021 — CoreLogic® (NYSE: CLGX), a leading global property information, analytics and data-enabled solutions provider, today released the CoreLogic Home Price Index (HPI™) and HPI Forecast™ for December 2020, providing a look back at the state of the housing market and the pandemic’s impact on home price performance throughout 2020.
This press release features multimedia. View the full release here: https://www.businesswire.com/news/home/20210202005396/en/
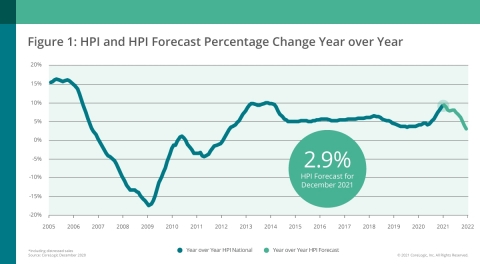
CoreLogic National Home Price Change and Forecast; December 2020 (Graphic: Business Wire)
The housing market exceeded expectations in 2020, closing out the year with the highest annual home price gain since February 2014 in December at 9.2%. Despite a blip in April, home-purchase demand surged as record-low mortgage rates persuaded first-time homebuyers to enter the market. Meanwhile, the consequences of the pandemic were seen in the dwindling supply of homes — dropping, on average, 24% below 2019 levels — as homeowners delayed selling.
These factors translated to significant home price growth in 2020, surpassing the previous year’s levels with an average monthly year-over-year gain of 5.7%, compared with 3.8% in 2019. However, with the severe shortage of for-sale homes, we may see rising affordability concerns and some prospective buyers priced out of the market in 2021.
Top Takeaways:
- Nationally, home prices increased 9.2% in December 2020, compared with December 2019. On a month-over-month basis, home prices increased by 1% compared to November 2020.
- December 2020 gains across all of the 10 select metropolitan areas (Table 1) surpassed their December 2019 levels.
- Affordability concerns continue to persist as prices continue to steeply rise. For instance, in San Diego, prices increased 10.4% year over year in December 2020 compared to the 3% gain December 2019. San Diego home prices are also forecasted to increase an additional 8.2% over the next 12 months.
- At the state level, Idaho, Indiana and Maine had the strongest price growth in December, up 19.1%, 16.1% and 15.2%, respectively.
“At the start of the pandemic, many braced for a Great Recession-era collapse of the housing market,” said Frank Martell, president and CEO of CoreLogic. “However, market conditions leading into the crisis — namely low home supply, desire for more space and millennial demand — amplified the rapid acceleration of home prices.”
“Two record lows are fueling home price gains: for-sale inventory and mortgage rates,” said Dr. Frank Nothaft, chief economist at CoreLogic. “Prospective sellers with flexible timetables have opted to delay listing their home until the pandemic fades or they are vaccinated. We can expect more inventory to come available in the second half of the year, leading to slowing in price growth toward year-end.”
The next CoreLogic HPI press release, featuring January 2021 data, will be issued on March 2, 2021 at 8:00 a.m. ET.
Methodology
The CoreLogic HPI™ is built on industry-leading public record, servicing and securities real-estate databases and incorporates more than 40 years of repeat-sales transactions for analyzing home price trends. Generally released on the first Tuesday of each month with an average five-week lag, the CoreLogic HPI is designed to provide an early indication of home price trends by market segment and for the “Single-Family Combined” tier, representing the most comprehensive set of properties, including all sales for single-family attached and single-family detached properties. The indices are fully revised with each release and employ techniques to signal turning points sooner. The CoreLogic HPI provides measures for multiple market segments, referred to as tiers, based on property type, price, time between sales, loan type (conforming vs. non-conforming) and distressed sales. Broad national coverage is available from the national level down to ZIP Code, including non-disclosure states.
CoreLogic HPI Forecasts™ are based on a two-stage, error-correction econometric model that combines the equilibrium home price—as a function of real disposable income per capita—with short-run fluctuations caused by market momentum, mean-reversion, and exogenous economic shocks like changes in the unemployment rate. With a 30-year forecast horizon, CoreLogic HPI Forecasts project CoreLogic HPI levels for two tiers — “Single-Family Combined” (both attached and detached) and “Single-Family Combined Excluding Distressed Sales.” As a companion to the CoreLogic HPI Forecasts, Stress-Testing Scenarios align with Comprehensive Capital Analysis and Review (CCAR) national scenarios to project five years of home prices under baseline, adverse and severely adverse scenarios at state, metropolitan areas and ZIP Code levels. The forecast accuracy represents a 95% statistical confidence interval with a +/- 2% margin of error for the index.
About Market Risk Indicator
Market Risk Indicators are a subscription-based analytics solution that provide monthly updates on the overall “health” of housing markets across the country. CoreLogic data scientists combine world-class analytics with detailed economic and housing data to help determine the likelihood of a housing bubble burst in 392 major metros and all 50 states. Market Risk Indicators is a multi-phase regression model that provides a probability score (from 1 to 100) on the likelihood of two scenarios per metro: a >10% price reduction and a ≤ 10% price reduction. The higher the score, the higher the risk of a price reduction.
About the Market Condition Indicators
As part of the CoreLogic HPI and HPI Forecasts offerings, Market Condition Indicators are available for all metropolitan areas and identify individual markets as “overvalued,” “at value,” or “undervalued.” These indicators are derived from the long-term fundamental values, which are a function of real disposable income per capita. Markets are labeled as overvalued if the current home price indexes exceed their long-term values by greater than 10%, and undervalued where the long-term values exceed the index levels by greater than 10%.
Source: CoreLogic
The data provided are for use only by the primary recipient or the primary recipient's publication or broadcast. This data may not be resold, republished or licensed to any other source, including publications and sources owned by the primary recipient’s parent company without prior written permission from CoreLogic. Any CoreLogic data used for publication or broadcast, in whole or in part, must be sourced as coming from CoreLogic, a data and analytics company. For use with broadcast or web content, the citation must directly accompany first reference of the data. If the data are illustrated with maps, charts, graphs or other visual elements, the CoreLogic logo must be included on screen or website. For questions, analysis or interpretation of the data, contact Valerie Sheets at newsmedia@corelogic.com. Data provided may not be modified without the prior written permission of CoreLogic. Do not use the data in any unlawful manner. The data are compiled from public records, contributory databases and proprietary analytics, and its accuracy is dependent upon these sources.
About CoreLogic
CoreLogic (NYSE: CLGX), the leading provider of property insights and solutions, promotes a healthy housing market and thriving communities. Through its enhanced property data solutions, services and technologies, CoreLogic enables real estate professionals, financial institutions, insurance carriers, government agencies and other housing market participants to help millions of people find, buy and protect their homes. For more information, please visit www.corelogic.com.
CORELOGIC, the CoreLogic logo, CoreLogic HPI and CoreLogic HPI Forecast are trademarks of CoreLogic, Inc. and/or its subsidiaries. All other trademarks are the property of their respective owners.
View source version on businesswire.com: https://www.businesswire.com/news/home/20210202005396/en/
Contact:
Valerie Sheets
newsmedia@corelogic.com


 Animation, 3D Art and 3D Models")