


—A 121-Month Evaluation on How the Nation’s Real Estate Market Has Impacted the Economy—
IRVINE, Calif. — (BUSINESS WIRE) — July 18, 2019 — CoreLogic® (NYSE: CLGX), a leading global property information, analytics and data-enabled solutions provider, today released its special report evaluating “The Role of Housing in the Longest Economic Expansion.” This year, the report analyzes the U.S. housing market’s impact on the latest 121-month economic expansion – the longest in the nation’s history. The report examines the housing economy and looks at the growth of gross domestic product (GDP), unemployment rates and housing activity from June 2009 through July 2019.
This press release features multimedia. View the full release here: https://www.businesswire.com/news/home/20190718005047/en/
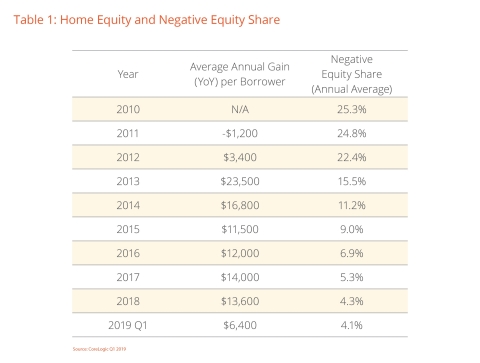
Table 1: Home Equity and Negative Equity Share; CoreLogic Q1 2019
Key Takeaways
- The percent of homes with negative equity went from 25.9% in the first quarter of 2010 to 4.1% in the first quarter of 2019.
- Total home equity hit a record of $15.8 trillion at the end of the first quarter of 2019, up from $6.1 trillion in the first quarter of 2009. Between the first quarter of 2010 and the first quarter of 2019, the average equity per borrower increased from approximately $75,000 to approximately $171,000.
- Since 2010, the housing flip rate has increased significantly. In the first quarter of 2018, the number of properties bought and sold again within a two-year period reached its highest point at 11.4%.
- Since June 2009, home prices and rents have continued to grow. Through May 2019, home prices increased a cumulative 50% and single-family rents increased 33% in the United States.
Rising employment rates typically have a positive impact on the housing economy as it can lead to an increase in potential home buyers and a decrease in negative equity (often referred to as being underwater or upside down, meaning borrowers owe more on their mortgages than their homes are worth). In the first quarter of 2010, 25.9% of the total number of mortgaged residential properties in the United States were in negative equity. As the market has improved over the past decade, this share dropped to 4.1% in the first quarter of 2019 (Table 1). A strong economy and an increase in total home equity helped to reduce the negative equity share. Total home equity reached a record of $15.8 trillion at the end of the first quarter of 2019, up from $6.1 trillion in the first quarter of 2009.
“During the last nine years, the expansion has created more than 20 million jobs, raised family incomes and rebuilt consumer confidence,” said Frank Nothaft, chief economist at CoreLogic. "The longest stretch of mortgage rates below 5% in more than 60 years has supplemented these factors. These economic forces have driven a recovery in home sales, construction, prices and home equity wealth.”
Housing has long been associated with wealth creation in the United States. Home flipping, or the act of buying a property with the intent to sell it quickly for a profit, is a tactic that some homeowners use to generate profit. Since the last recession, the flipping rate has increased significantly: the two-year flip rate reached its highest point in the first quarter of 2018 at 11.4%, up from its lowest level (4.9%) in the third quarter of 2010. (Figure 4)
Home prices began falling just before the start of the recession and continued to decline at a more rapid pace throughout 2008 and 2009. However, from June 2009 through May 2019, home prices and rents have continued to grow. Through May 2019, home prices increased a cumulative 50% and single-family rents increased 33% in the United States. In the first quarter of 2019, 1.1 million new owners joined the housing economy, while the number of renters increased by 458,000. (Figure 3)
With increasing home prices after the recession, many first-time buyers delayed homeownership, choosing to rent for longer. However, in 2018, millennial buyers – those born from 1981 to 1996 – reversed this trend by becoming the largest cohort for finance-home purchases, accounting for 44% of home-purchase mortgage applications. These millennial buyers are looking for affordability and not buying in the typical coastal cities seen in the past. According to CoreLogic Market Condition Indicators (MCI), in May 2019, four of the top 10 metros for millennial buyers were undervalued (Pittsburgh; Rochester, New York; Wichita, Kansas and Grand Rapids, Michigan), five metros were at value (Buffalo, New York; Milwaukee; Albany, New York; Provo, Utah and Des Moines, Iowa) and one metro was overvalued (Salt Lake City). Metros in California had the lowest percentage of millennials applying for a mortgage.
Despite an unemployment rate near a 50-year low, inflation rates below the Federal Reserve Board’s 2% target and strong GDP growth (3.1%) in the first quarter of 2019, concerns of a looming recession have been rising. The report explores recent recession indicators and looks at how the housing economy could weather the next dip.
To download and read the full special report, visit: https://www.corelogic.com/insights/special-report-the-role-of-housing-in-the-longest-economic-expansion.aspx.
Methodology
The data in this report represents home price activity reported through May 2019 and home equity data through the second quarter of 2019.
CoreLogic Home Equity Data: The amount of equity for each property is determined by comparing the estimated current value of the property against the mortgage debt outstanding (MDO). If the MDO is greater than the estimated value, then the property is determined to be in a negative equity position. If the estimated value is greater than the MDO, then the property is determined to be in a positive equity position. The data is first generated at the property level and aggregated to higher levels of geography. CoreLogic data includes more than 50 million properties with a mortgage, which accounts for more than 95% of all mortgages in the U.S. CoreLogic uses public record data as the source of the MDO, which includes both first-mortgage liens and second liens, and is adjusted for amortization and home equity utilization in order to capture the true level of MDO for each property. The calculations are not based on sampling, but rather on the full data set to avoid potential adverse selection due to sampling. The current value of the property is estimated using a suite of proprietary CoreLogic valuation techniques, including valuation models and the CoreLogic Home Price Index (HPI). Only data for mortgaged residential properties that have a current estimated value are included. There are several states or jurisdictions where the public record, current value or mortgage data coverage is thin and have been excluded from the analysis. These instances account for fewer than 5% of the total U.S. population.
The CoreLogic HPI™ is built on industry-leading public record, servicing and securities real-estate databases and incorporates more than 40 years of repeat-sales transactions for analyzing home price trends. Generally released on the first Tuesday of each month with an average five-week lag, the CoreLogic HPI is designed to provide an early indication of home price trends by market segment and for the “Single-Family Combined” tier, representing the most comprehensive set of properties, including all sales for single-family attached and single-family detached properties. The indices are fully revised with each release and employ techniques to signal turning points sooner. The CoreLogic HPI provides measures for multiple market segments, referred to as tiers, based on property type, price, time between sales, loan type (conforming vs. non-conforming) and distressed sales. Broad national coverage is available from the national level down to ZIP Code, including non-disclosure states.
CoreLogic Market Condition Indicators (MCI) analysis categorizes home prices in individual markets as undervalued, at value or overvalued. The MCI analysis defines an overvalued housing market as one in which home prices are at least 10% higher than the long-term, sustainable level. It defines an undervalued housing market as one in which home prices are at least 10% below the sustainable level.
The CoreLogic Single-Family Rent Index (SFRI): The single-family rental market accounts for half of the rental housing stock, yet unlike the multifamily market, which has many different sources of rent data, there are minimal quality adjusted single-family rent transaction data. The CoreLogic Single-Family Rent Index (SFRI) serves to fill that void by applying a repeat pairing methodology to single-family rental listing data in the Multiple Listing Service. CoreLogic constructed the SFRI for over 70 Core Based Statistical Areas (CBSAs)—including 40 CBSAs with four value tiers— and a national composite index.


 Animation, 3D Art and 3D Models")