


Notes to editors
Urban mobility is a key contributor to issues such as climate change, health and economic development and the TomTom traffic index has become the barometer of mobility patterns around the world. TomTom’s traffic data, which is powered by 600 million connected devices, is an authoritative indicator of how people move, economic activity levels, global trade and much more. Since the onset of the COVID-19 pandemic, TomTom’s traffic insights have been used by analysts, corporations and the media to explain a world in flux.
The TomTom Traffic Index report is online
At
tomtom.com/TrafficIndex, people can discover where their city ranked in 2021, how congestion changed month-by-month and year-on-year. They can see the most congested days and even most congested hours of the day – and work out the best times to travel. For the first time, the Traffic Index includes detailed emissions data for 4 cites: London, Paris, Berlin and Amsterdam.
What is the Congestion Level?
Congestion Level percentage is the extra travel time a driver will experience when compared to an uncongested situation. A 50% congestion level means that on average, travel times were 50% longer than during the baseline uncongested conditions. This means that a 30-minute trip driven in free-flow condition will take 15 minutes longer (30’ x50% = 15’) when the congestion level is at 50%.
TomTom calculates the baseline per city by analyzing free-flow travel times of all vehicles on the entire road network – recorded 24/7, 365 days a year.
TomTom performs calculations for all hours of each day, so you can see congestion levels at any time in any city, including morning and evening peak hours.
What is TomTom Traffic?
Analysing real-time incidents and congestion to predict traffic before it happens,
TomTom’s Real-Time Traffic makes TomTom navigation software more accurate with enhanced route calculations and accurate estimated times of arrival (ETA).
TomTom Traffic is used by more than 600M devices around the world, including smartphone apps and embedded navigation for most car manufacturers. TomTom is at the stake of the future of driving, providing highly attributed maps for advanced driver assisted systems and efficient electric vehicle routing and charging – which means that carmakers, technology companies, road authorities and governments already have the tools to make the roads less congested.
Emission Methodology
Emission from traffic is directly proportional to vehicle’s energy consumption. Consumption models is estimated by leveraging TomTom traffic data that provides detailed information of traffic patterns with a 1Hz resolution and map data (slopes, road classes) as inputs. To raise those consumption models, TomTom used the PHEM (Passenger car and Heavy-duty Emission Model) simulation tool, developed by the Graz University of Technology (TU Graz). PHEM calculates the energy required to perform any observed driving manoeuvres (speeds, accelerations) from TomTom data for different road profiles, and estimates the resulting emissions, based on the vehicle efficiency, vehicle type (car, van, motorcycle, truck, bus etc.) and energy type (Petrol, Diesel, Hybrid or electric), as well as driving patterns (gears, acceleration manoeuvres, etc.).
About TomTom
At TomTom we’re mapmakers, providing geolocation technology for drivers, carmakers, enterprises and developers.
Our highly accurate maps, navigation software, real-time traffic information and APIs enable smart mobility on a global scale, making the roads safer, the drive easier and the air cleaner.
Headquartered in Amsterdam with offices worldwide, TomTom’s technologies are trusted by hundreds of millions of drivers, businesses and governments worldwide.
For further Information
Media Relations TomTom:
tomtom.pr@tomtom.com
Investor Relations TomTom:
ir@tomtom.com
A photo accompanying this announcement is available at https://www.globenewswire.com/NewsRoom/AttachmentNg/e43e465d-3115-469d-9601-9428cb032f20

![]()
Annual TomTom Traffic Index the World at the Pace of the Pandemic
Annual TomTom Traffic Index the World at the Pace of the Pandemic
Variation of the yearly Congestion Level – 2021 vs 2019 (pre-COVID)
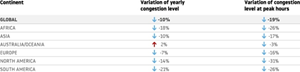
Variation of the yearly Congestion Level – 2021 vs 2019 (pre-COVID)
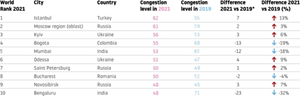
Ranking of the most congested cities worldwide (overall daily congestion level)


 Animation, 3D Art and 3D Models")